What is a Linear Graph?
Linear the word itself means straight. This is a line drawn in a graph that has no curves. To draw the linear graph we have to plot coordinates.
Usually, an equation is given in the line equation format:

- When y=x ( positive)

- When y=-x (negative)

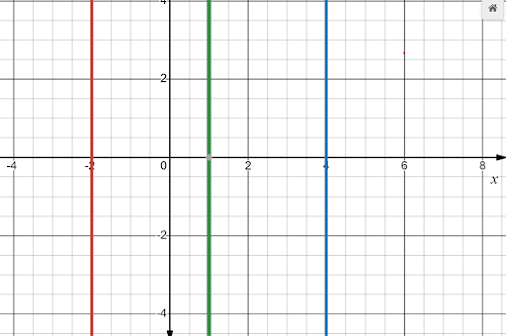
Some Special Cases
- When:
- y= 4 (Blue Line)
- y= 1 (Green Line)
- y= -2 ( Red Line)

- When:
- x= 4 (Blue Line)
- x= 1 (Green Line)
- x= -2 ( Red Line)
How to Draw a Linear Graph?
The question would have an equation with 2 unknown variables x and y.
Examples:
a) 2x-y=4
b) y-x=9
c) x= 3y-6
d) y= -7x-3
Step 1: Check if the question gives a range such as -4 ≤ x ≤ 4. This indicates x-axis should be from -4 to 4. Draw the x-axis and y-axis on graph paper accordingly.

Step 2: Draw a table of values. This table can be drawn in vertical and horizontal format. It should have at least 3 values for x. The values for x should be based on the range or x-axis drawn on the graph.


Step 4: Plot the coordinates accurately. Draw the line and label the line with the given equation
Extra Exercises to attempt.
Nicely arranged and easy to understand
ReplyDelete